
Start Making Senseof your Steam Sales Data.
Track sales, units, wishlists, traffic, campaigns and take-home earnings across your entire portfolio-without switching between pages and browser tabs.
Get Full Control Over Your Indie Publishing!
Connected context
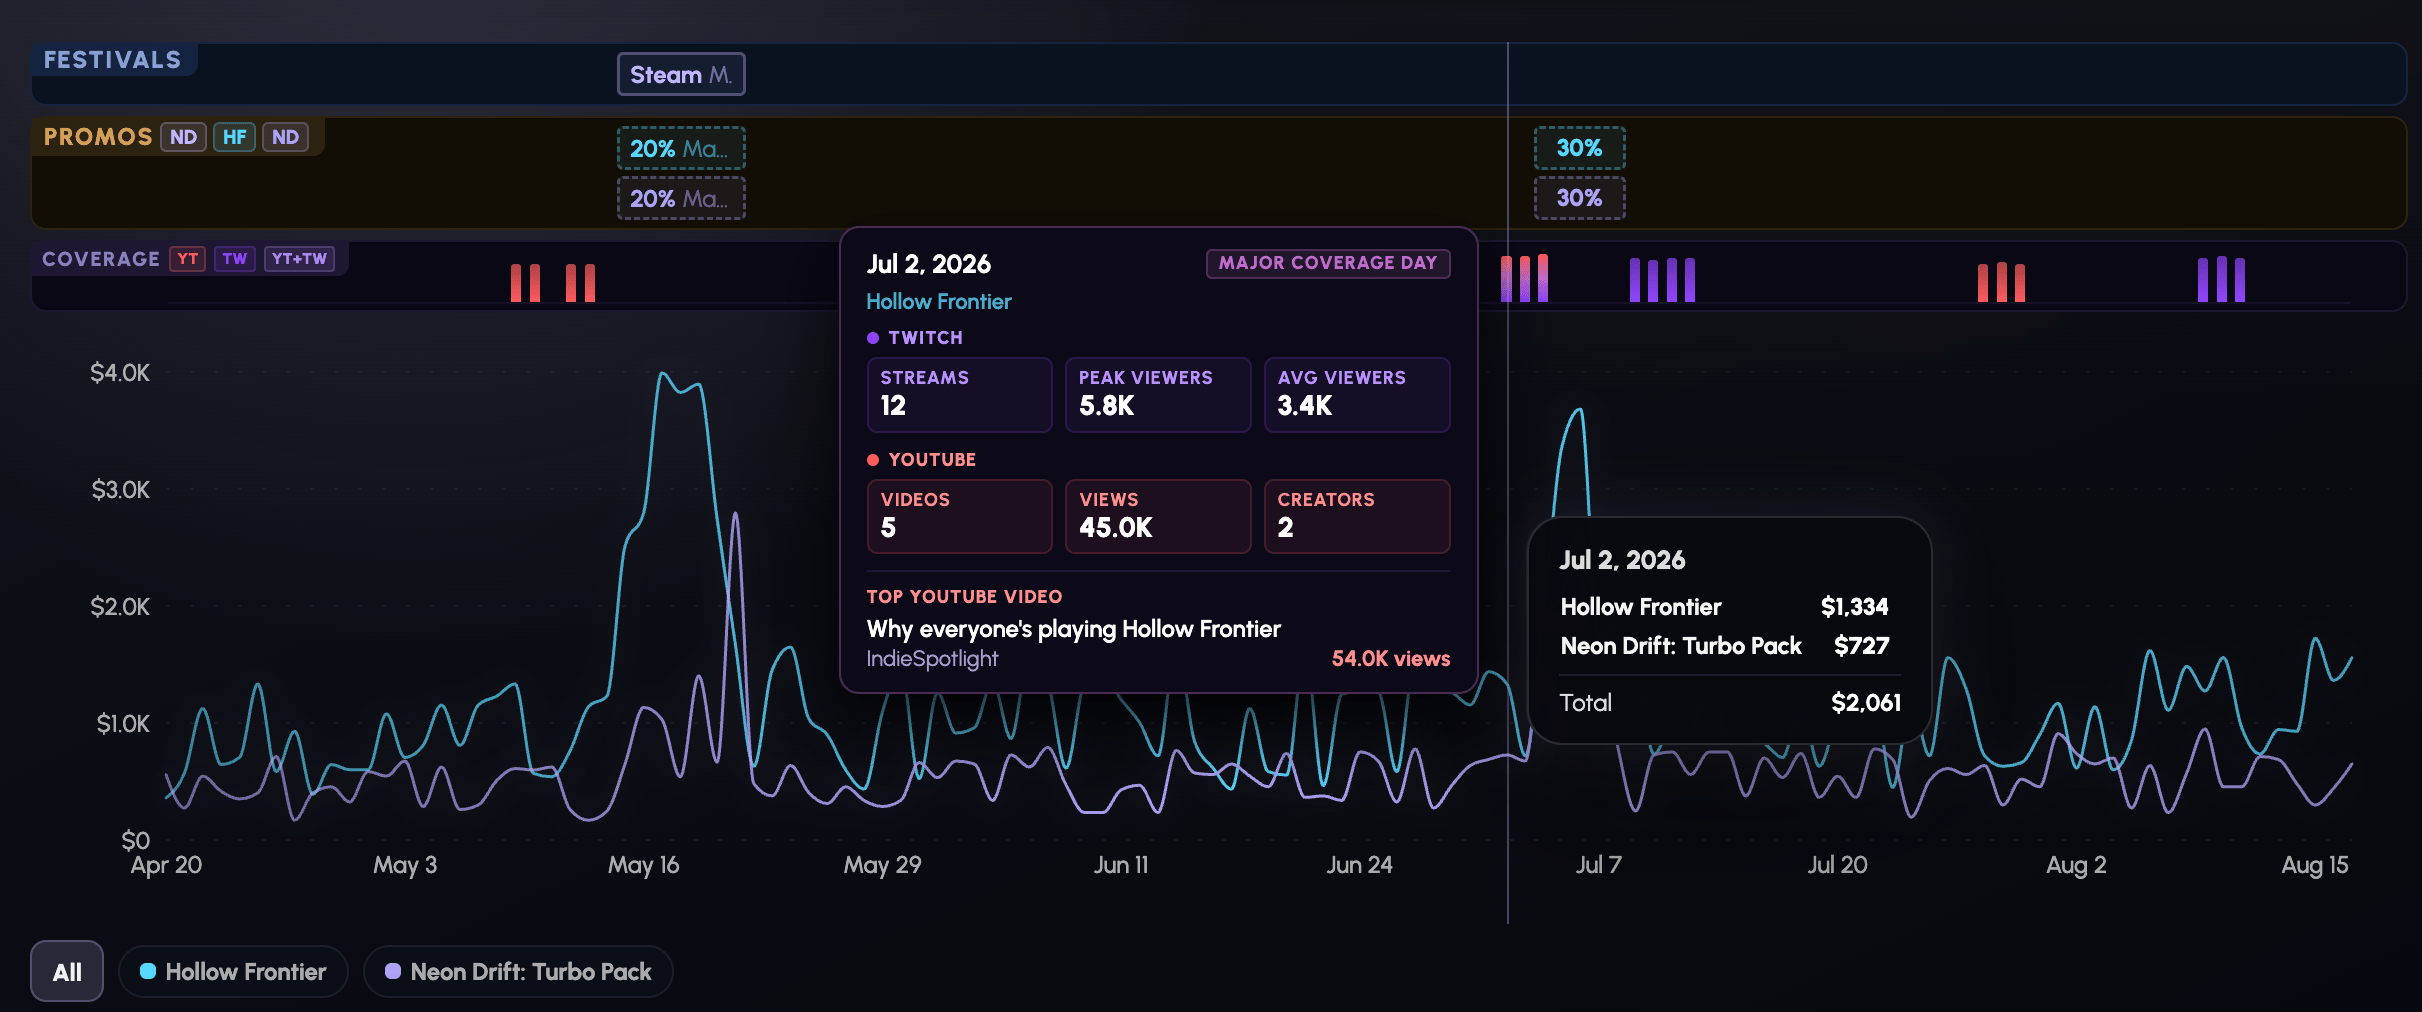
See what caused the spike.
Festivals, promotions, YouTube videos and Twitch streams sit in lanes directly above the chart - and not only revenue. The overlay runs on wishlists, units and traffic too, so whatever moved, you can see what lined up with it.
Your whole catalogue
All your games, side by side.
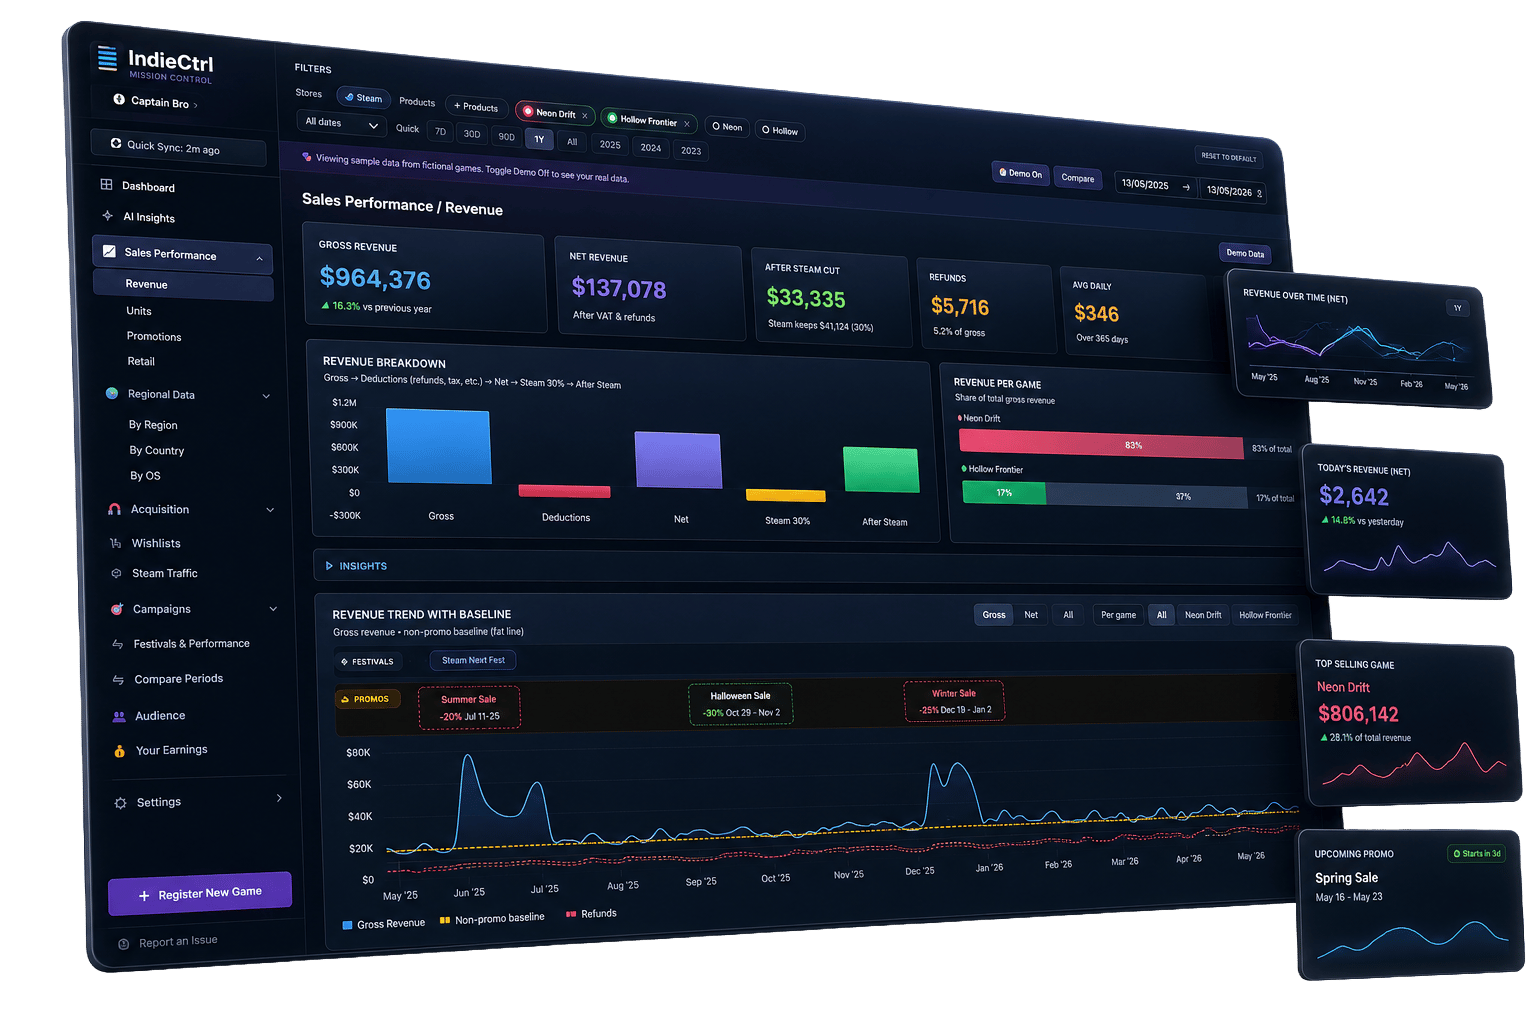
Connect every title and DLC you publish and see them together on the same charts. Show or hide any of them with one click and every breakdown follows - revenue, wishlists, traffic, regions, promotions, all of it.
No switching between pages and browser tabs, no jumping between partner organisations, and no exporting two games into a spreadsheet just to line them up. It saves you hours every week - and with the whole catalogue in front of you, your next move is far easier to read.
Portfolio filters
3 games connected
Net revenue
$137,078
Units
24,610
Wishlist adds
18,842
- Detected for you
- Automatic
- Promos found and dated without manual entry.
- vs baseline
- Real lift
- Revenue above normal trade, not the headline total.
- vs previous promo
- Side by side
- Was the deeper cut actually worth it?
- Next window
- Tracked
- When each title can discount again.
Discount performance
Measure the lift, not just the discount.
Every promotion scored the moment it ends, so your next one is a decision you can defend - not a guess.
What you get
Every angle on your Steam analytics, ready to read.
Sales & units
Gross, net, refunds and Steam's share by day, month, game or country, with a heatmap of your strongest selling days.
Wishlists
Adds, deletions and conversions, with wishlist impact set beside your sales - combined across the catalogue or per title.
Regional breakdowns
Revenue, units and wishlists by region, country and OS, on a bar chart or a shaded world map.
Steam traffic
Impressions, click-through and visits for every store surface, collected by our extension since Steam's API doesn't expose it.
Players & reviews
Concurrent players, ratings and review sentiment across the portfolio or per game - and translate any review in one click.
Compare anything
Line up two periods, two games, or two festivals you applied to - day by day - to see which actually worked.
DLCs, your way
Fold DLCs into the base game for a whole-product view, or split them out to judge each on its own.
Festival tracking
Applications, acceptances and event dates, marked on the charts they influenced.
Export & reports
CSV for your own analysis, plus investor-ready PDF and PowerPoint decks for your stakeholders.
Your earnings
Know the payment that actually reaches you.
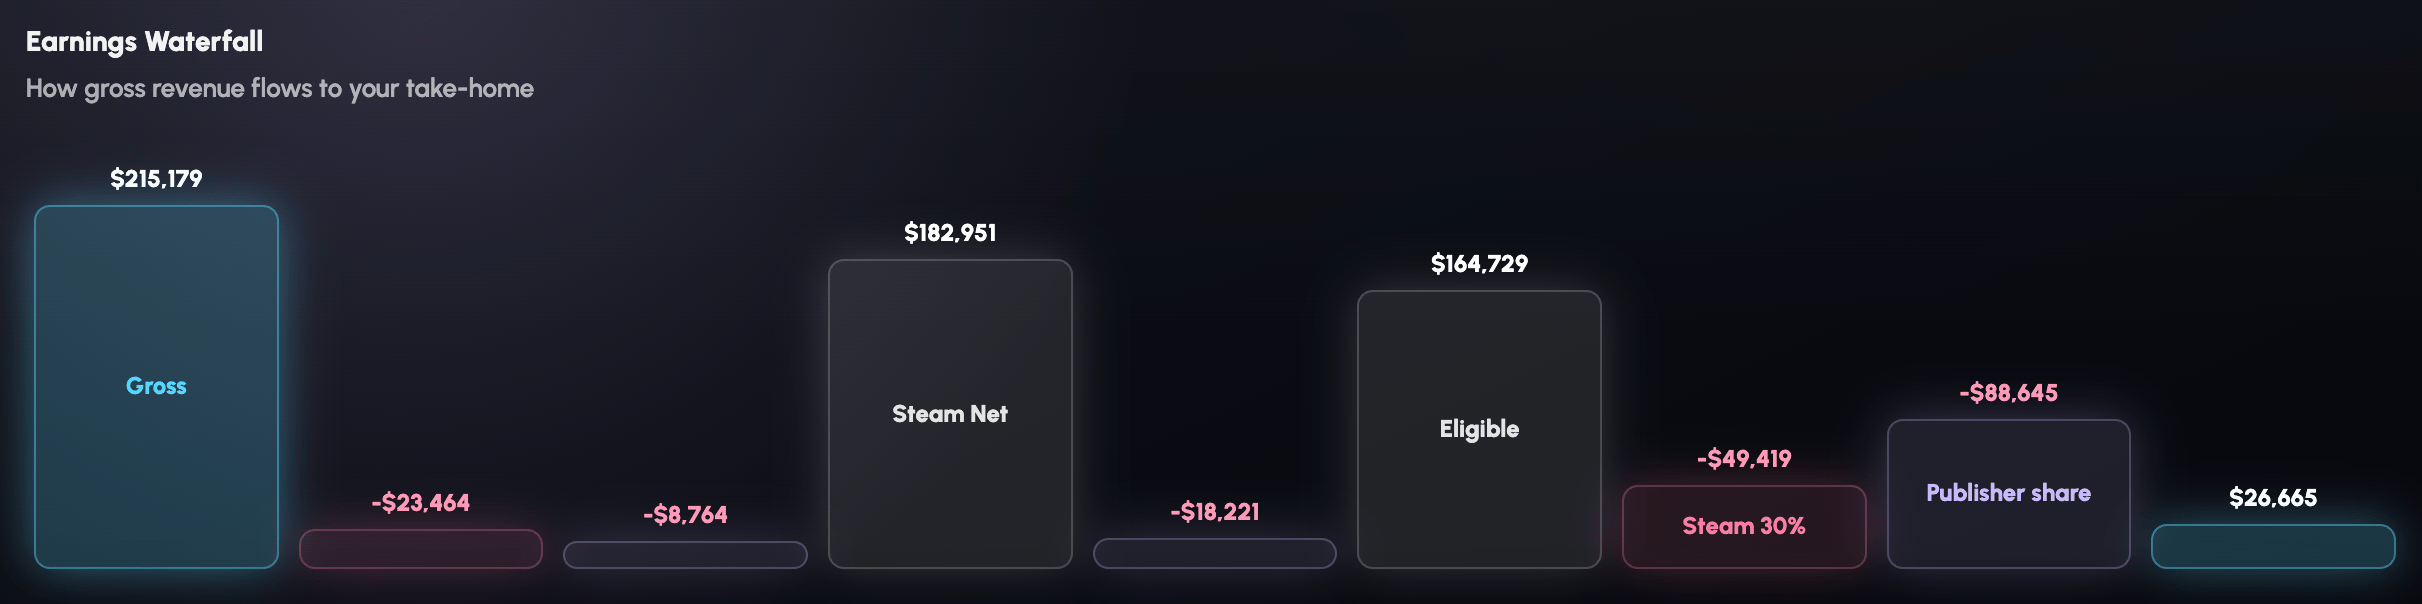
Steam's dashboard shows you gross. What lands in your account is what is left after refunds, tax, Steam's cut and whatever your publisher or co-development deal takes. Set each game's split once - including a different partner per territory, or excluding regions you earn nothing from - and every period shows the payment that actually reaches you, per title or across the whole portfolio.
How it connects
Three connections, then it runs itself.
- 01

Connect Steamworks
Your API key and App IDs bring in sales, wishlists, promotions, regions, players and reviews.
- 02
Traffic extension
A free Chrome extension adds your store traffic breakdown - impressions, click-through and visits.
- 03


Creators & festivals
Run one creator search per game - IndieCtrl then tracks its YouTube and Twitch coverage automatically, with festival dates alongside.
Your data
Your numbers stay yours.
Your sales and revenue are some of the most sensitive figures you have. We treat them that way, and we take protecting them seriously.
Your API key, encrypted at rest
The moment you save your Steamworks key it's encrypted with AES-256-GCM. The key that unlocks it lives on our server, never in the database beside it.
Never shown in your browser
After you save it, your key is never sent back to your browser. The app only ever knows that a key is connected, not what it is.
Isolated to you
Every workspace is walled off at the database level, so your data is only ever visible to you and the teammates you invite.
Never sold, never shared
Your numbers are yours. We don't sell them or hand them to advertisers, and you can disconnect your key at any time.
Grow revenue
Find the creators already covering games like yours.
Search any title close to yours and IndieCtrl builds a list of the YouTubers and Twitch streamers who covered it - audience size and contact details included - so you know exactly who to reach before your next launch or sale.
- Search by any game similar to yours
- Real reach, recent coverage and contact details
- Save your outreach list and track who covered you back
Games like yours




SplatterCatGaming
YouTube · 1.2M subscribers

Olexa
YouTube · 512K subscribers

Retromation
YouTube · 388K subscribers
Questions
Steam analytics, plainly answered.
Can I track multiple Steam games in one dashboard?+
Yes. IndieCtrl brings every game in your catalogue into one portfolio view. Show or hide individual titles, compare selected games, or view the complete portfolio without switching between pages and browser tabs.
What Steam data can IndieCtrl track?+
IndieCtrl tracks sales, revenue, units, refunds, wishlists, regional performance, promotions, traffic, players, reviews and earnings. Available data depends on the Steam reports and connections enabled for your account.
Can I see what caused a sales or wishlist spike?+
Festivals, promos and creator coverage sit on the same chart as the spike, so the cause is directly above the effect - no hunting across tabs.
Did that YouTube or Twitch campaign work?+
Coverage lands on your charts as a marker, so you can see at a glance whether a video or stream produced any lift in the days that followed.
Did the deeper discount earn more, or just sell the same copies cheaper?+
Each promo is measured against your non-promo baseline and against your previous promo, so you can tell whether the deeper cut actually grew the pie.
Which of my games should I put the next month into?+
Your whole catalogue on one filter - revenue, wishlists and traffic side by side instead of a tab per title.
Is it worth localising for this market?+
Revenue, units and wishlists by region, country and OS, so the answer comes from your own sales rather than a general rule.
What do I actually take home from this?+
Gross through refunds, tax, Steam's cut and your publisher split, per game or across the portfolio - so you see the payment that actually reaches you.
Does the dashboard calculate Steam and partner revenue shares?+
Yes. The earnings view breaks revenue down from gross sales through deductions and Steam's share, then applies your configured publisher, developer or partner splits per game or across the portfolio.
One portfolio. One source of truth.
Stop rebuilding the picture. Start reading it.
Explore the complete Steam analytics dashboard with demo data before connecting your own games.
Start Free Demo